


To analyze Google Forms responses, open the form’s Responses tab: Summary shows a chart for each question, and Question and Individual show the answers one question or one submission at a time. To filter, compare groups or build pivot tables, link the form to Google Sheets. For drop-off data, metric-based alerts or reusable shareable reports, use a reporting tool.
What we’ll cover:
What Google Forms shows you
Open your form and click Responses. Google Forms gives you three views:
- Summary: a chart or list for each question, so you can see how answers are spread at a glance.
- Question: every answer to one question, which is useful for reading written answers.
- Individual: one submission at a time.

Google and Google Forms are trademarks of Google LLC.
The Responses tab counts submitted responses only, so it does not show how many people opened the form and left without submitting. On eligible Google Workspace or Google AI plans, Gemini can summarize open-text responses when the form meets its requirements, such as having 3 to 200 responses; it does not summarize quiz responses. See how Gemini works in Google Forms for its other limits.
Set up the form so responses are easy to analyze
Analysis is easier when the form collects answers in a shape you can count:
- Use choice questions for anything you want to group by, such as department, location or rating. Free-text answers like “Sales”, “sales team” and “SLS” become three different groups.
- Ask the grouping question once, make it required, and place it near the start, so every submitted response can be grouped the same way.
- Keep one idea per question. “How satisfied are you with the price and the support?” is hard to interpret reliably, because a low score doesn’t show which part caused it.
If many people start the form and few finish, the form itself may be the problem. See why people abandon forms and how to bring them back.
Filter and compare responses in Google Sheets
For anything beyond the summary charts, move the responses to Google Sheets. Each response becomes a row, and each question a column.
- Link the form to a sheet. In the form’s Responses tab, click Link to Sheets, or click More, then Select destination for responses, and choose Create a new spreadsheet or Select existing spreadsheet. If you create a new response spreadsheet, form collaborators automatically get access to it. Later sharing changes to the form are not copied to the sheet, so check the sheet’s sharing settings.
- Filter to one group. In the sheet, select the data and click Data, then Create a filter. Click the filter icon in a column header to filter by values, for example one department, or by condition, for example a date range. If other people use the same sheet, click Data, then Create filter view instead: a filter view changes only your view, and you can share it.
- Count answers by group. Select the data and click Insert, then Pivot table. In the side panel, add the grouping question, such as Team, under Rows. For a rating on a number scale, add it under Values and summarize it by AVERAGE to compare teams. For a choice question, add it under Columns, then add it again under Values and summarize it by COUNTA. This shows how many people in each team chose each answer.
You can also sort by any column and add charts for the comparisons the Summary view does not draw.
Filters and charts in the sheet do not change the responses stored in the form. The trade-off is that you build and maintain every view yourself, and the sheet only knows about submitted responses.
Google Forms, Google Sheets and a reporting tool compared
| Google Forms Summary | Google Sheets | PlatoForms Insights | |
|---|---|---|---|
| Charts for each question | Yes, automatic | You build them | Yes, a default report for every form |
| Filter to a group | Use the linked sheet | Yes | Yes, and filters can be saved |
| Compare groups (cross-tabs) | Use the linked sheet | Yes, with pivot tables | Yes, breakdowns on paid plans |
| Where people stop | No, submitted responses only | No | Yes, a funnel from opened to started to submitted, and the fields where people stop |
| Written answers | Read them one by one, or summarize them with Gemini on eligible plans | Read them in the sheet | Group them by theme and sentiment with AI |
| Alerts and sharing | New-response email notifications, and an optional results summary for respondents | Share the sheet | Email alerts, share links and email digests (share links and digests on paid plans) |
Analyze a form’s responses with PlatoForms Insights
Insights creates a report for every PlatoForms form automatically, with a submissions-over-time chart and a chart for each reportable field. If your form is in Google Forms, you can import it for free: your questions, sections and supported question types come across, and your original form is not changed.
What Insights adds:
-
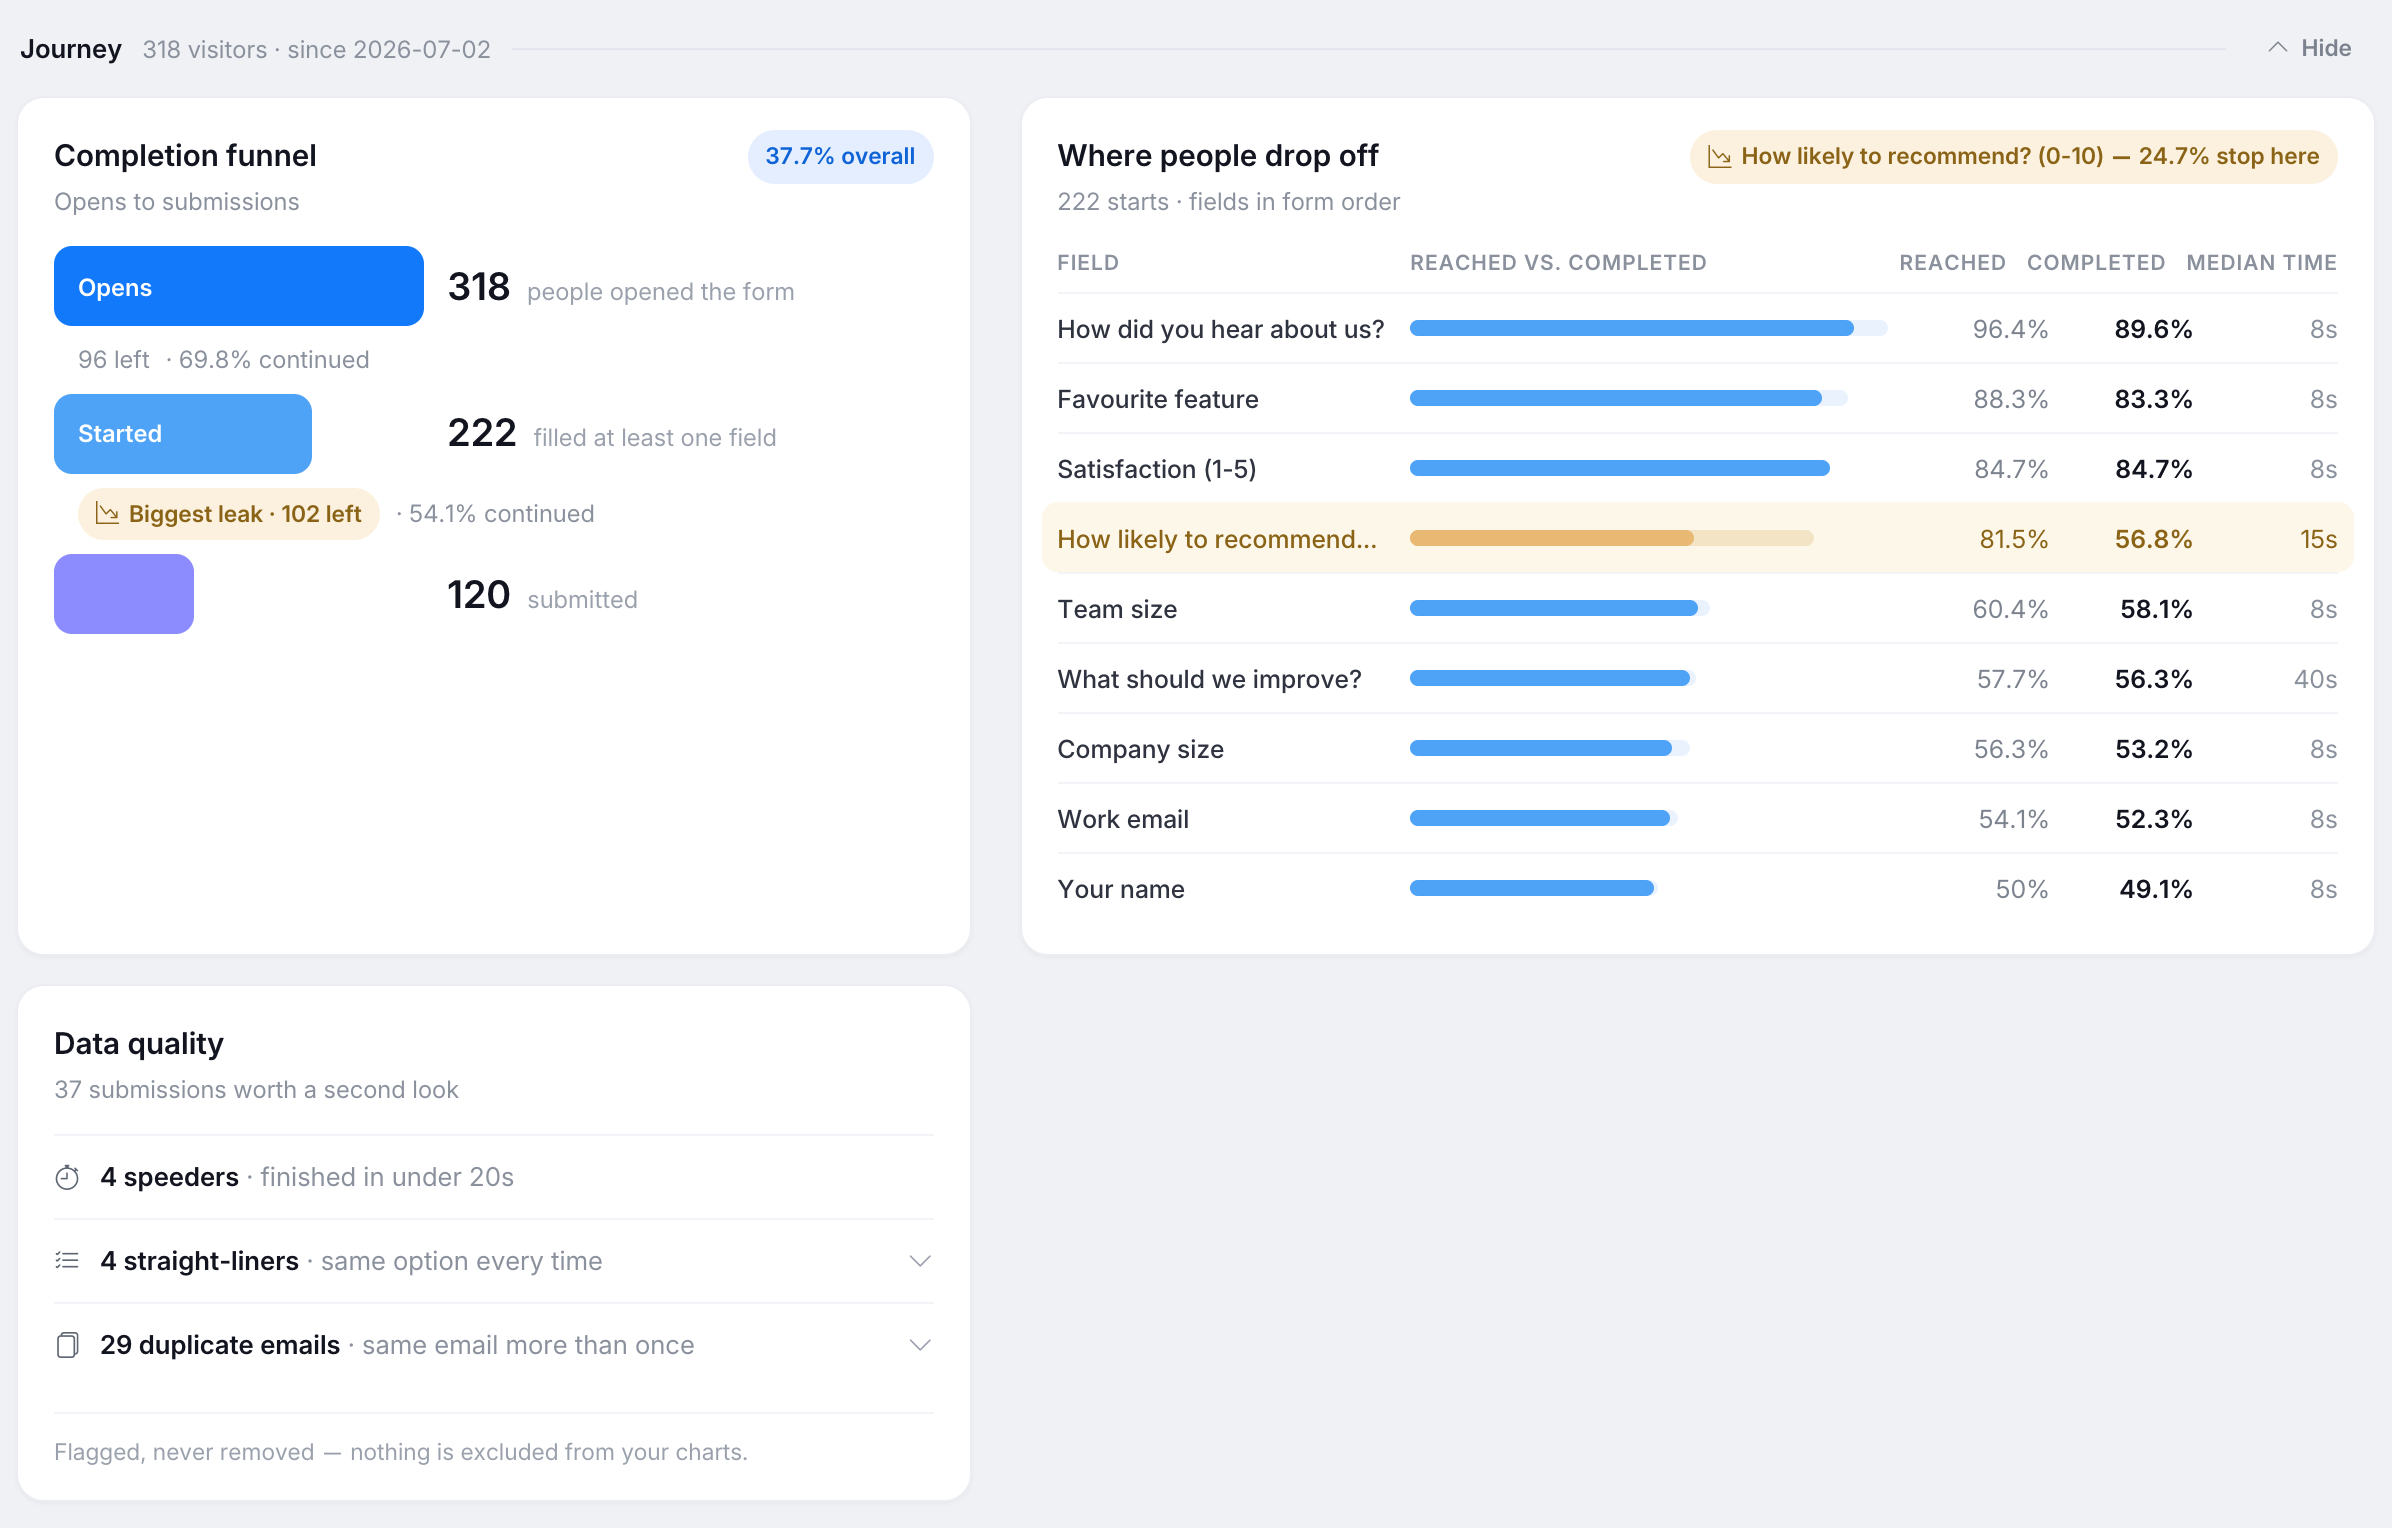
Where people stop. The visitor journey shows how many people opened the form, started it and submitted it, marks the biggest leak, and lists the fields where people stop.
-
Filters you can keep. Click a chart value to drill in, filter the report, and save filters you use often.
-
Written answers, grouped. AI in Insights groups text answers by theme and sentiment, writes summaries, and answers questions about the report. It uses your team’s AI credits.
-
Goals, alerts and sharing. Set a submission goal, get a weekly email alert when a metric meets a condition you set, and share the report by link or a weekly or monthly email digest.

To review individual submissions, the Submissions table lets you sort by any column, combine up to 5 columns, and filter by submitted date.
The free plan includes Insights with up to 5 charts per report; breakdowns, share links and email digests need a paid plan. Importing copies the form, not its responses: your existing answers stay in Google Forms and in any linked Google Sheet, and Insights reports on what the imported form collects from then on.
FAQ
How can you view the summary of responses in Google Forms?
Open the form and click Responses, then the Summary tab. It shows a chart or list for each question and appears once the form has at least one response. Use the Question tab to read every answer to one question, and the Individual tab to see one submission at a time.
How to summarize data from Google Forms?
Start with the Summary tab, which charts each question automatically. To summarize by group, such as satisfaction by team, link the form to Google Sheets and build a pivot table. On eligible Google Workspace or Google AI plans, Gemini can also summarize open-text responses.
Can you extract data from Google Forms?
Yes. In the Responses tab, click More, then Download responses (.csv) to get every response as a CSV file. To keep working with the data as new responses arrive, link the form to a Google Sheet instead.
Can I analyze my existing Google Forms responses in PlatoForms?
No. Importing a Google Form into PlatoForms copies the form’s questions, sections and supported question types, not its responses, which stay in Google Forms and in any linked Google Sheet. PlatoForms Insights reports on the submissions the imported form collects from then on.


