
Visitor journey
On this page
Visitor journey helps you understand whether people leave before starting a form or stop while completing a particular field. It also identifies submissions that may need a data-quality review.
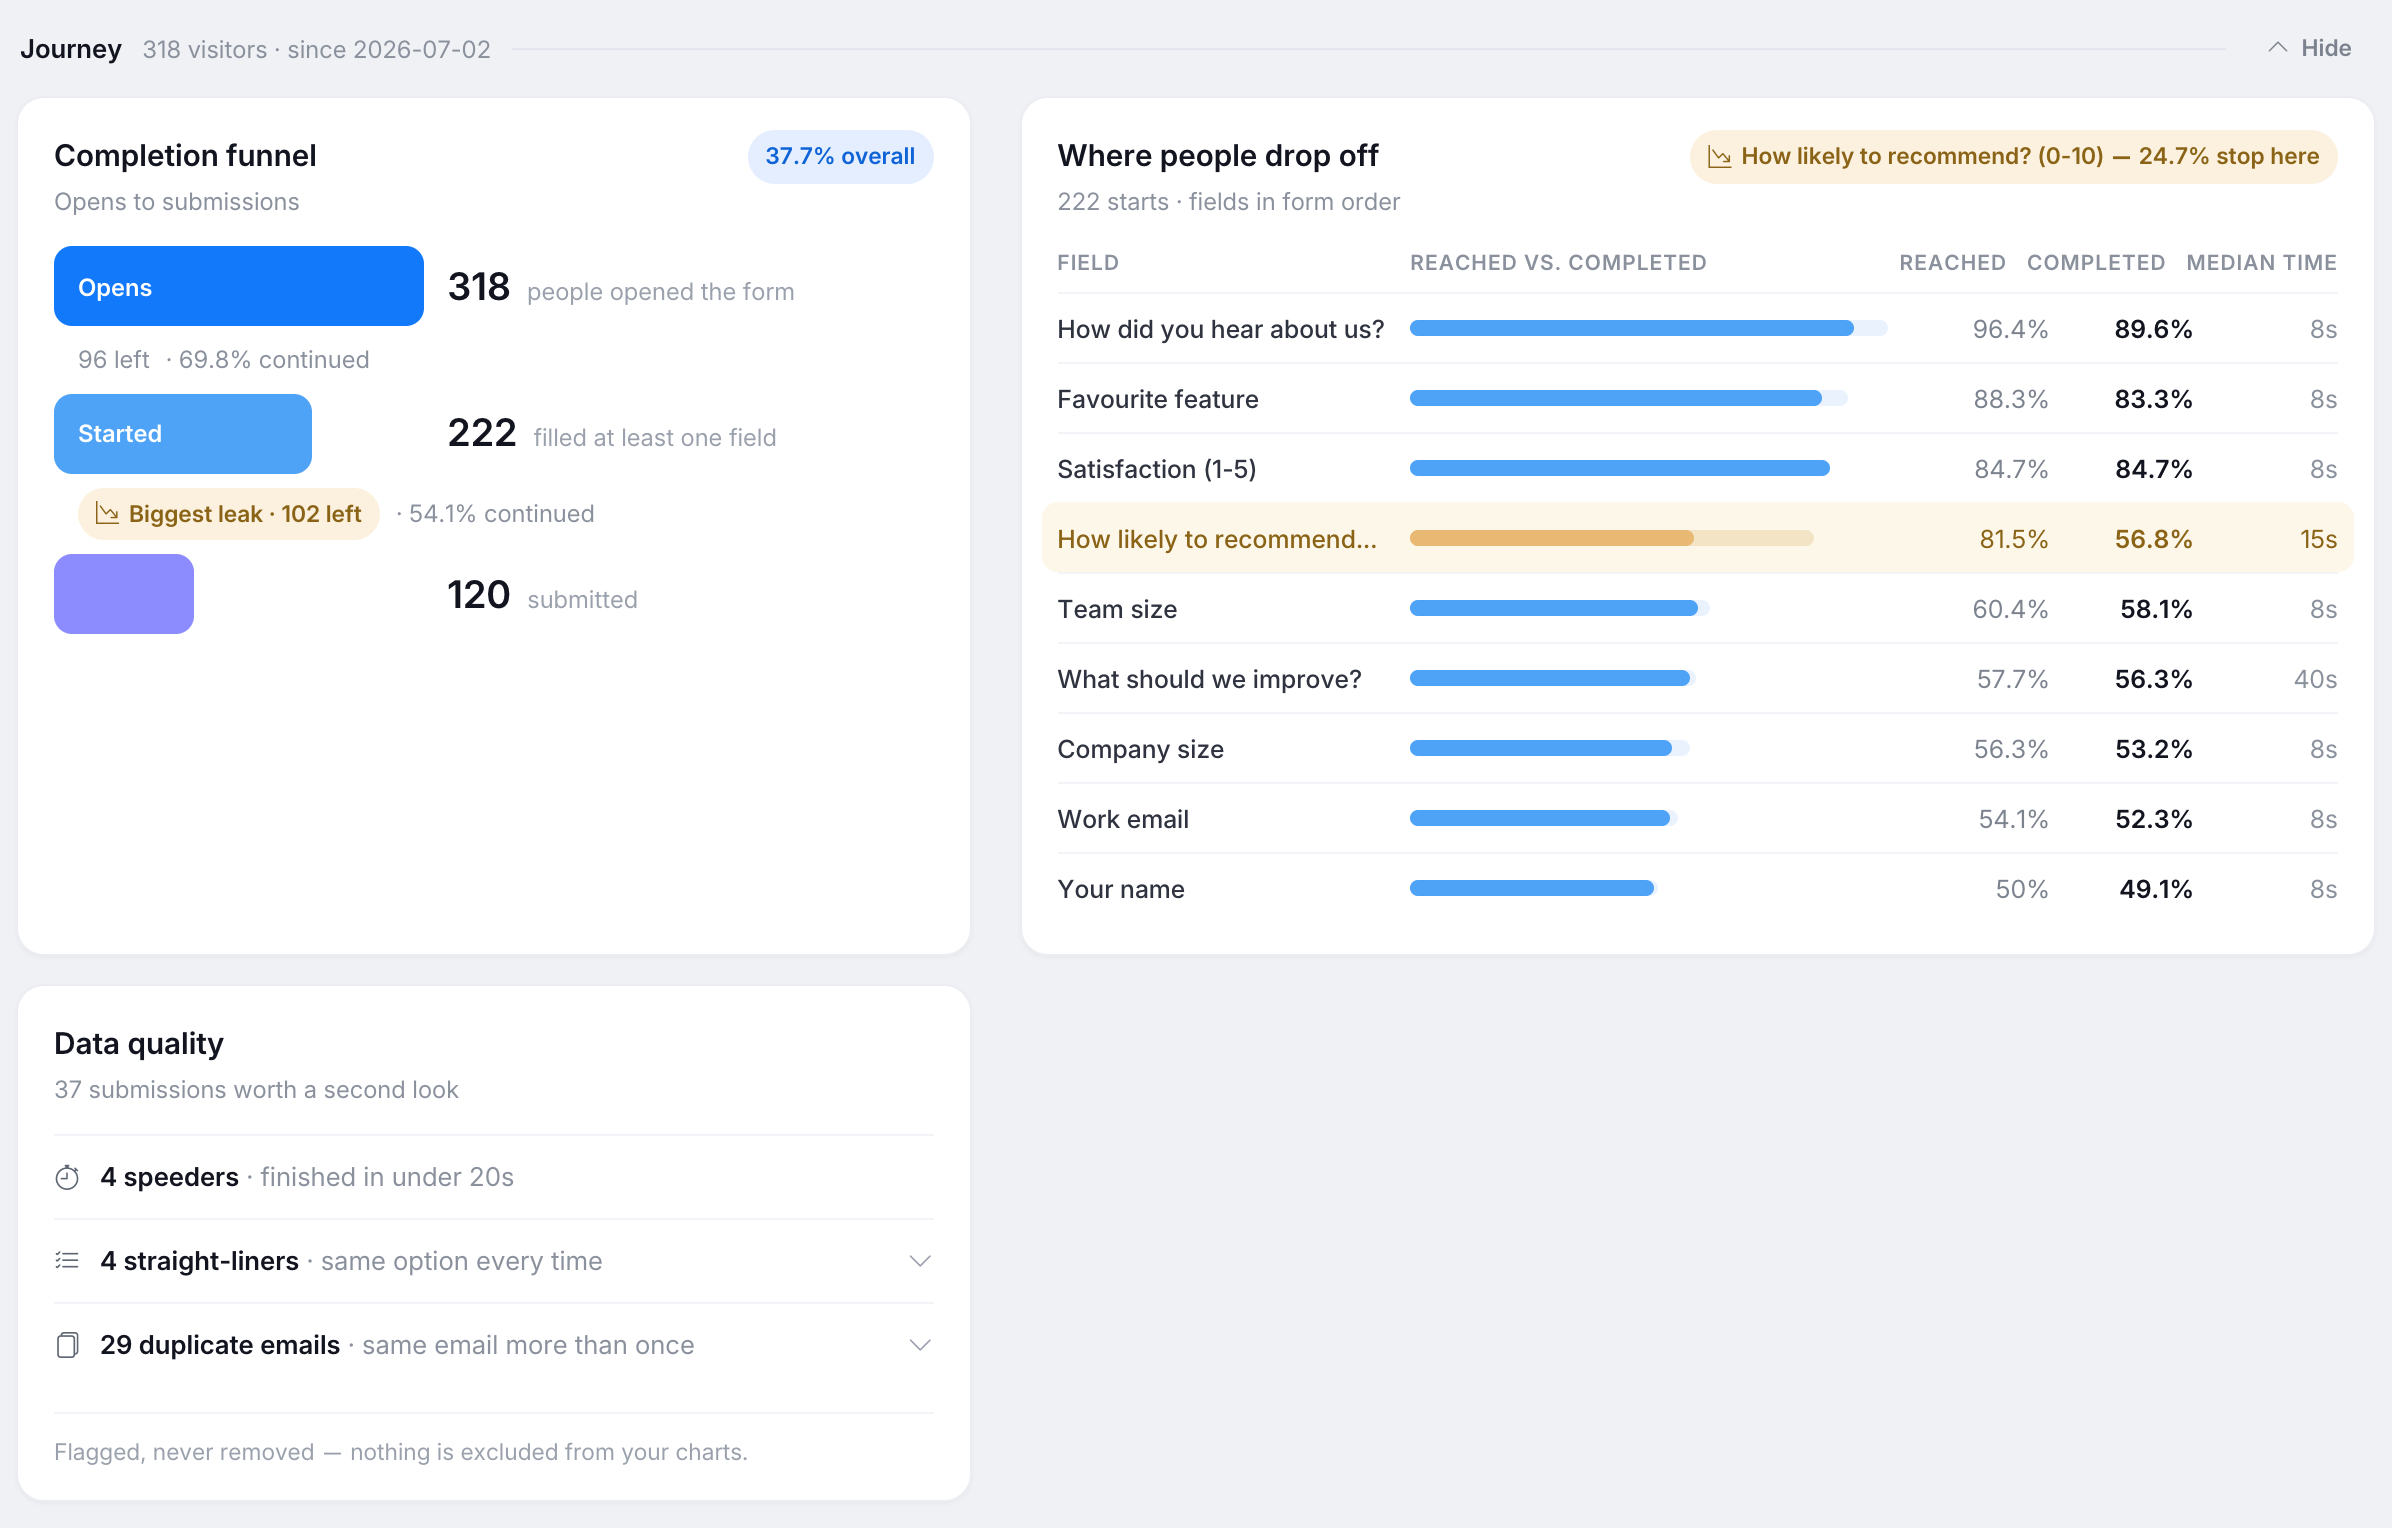
The Journey band appears between the KPI tiles and the charts. Its figures count visitors, based on behavioral events from the published form page, rather than submissions. For this reason, Journey figures are shown separately from submission-based report data. Use Hide or Show to collapse or expand the band. This setting is saved for each report.
If the Journey band looks empty on an older form, re-publish the form. Page opens are recorded for all forms; field-level journey data only flows from form pages published after Insights launched.
Completion funnel
The funnel contains three stages:
- Opens — people who opened the form.
- Started — people who filled at least one field.
- Submitted — people who submitted the form.
The funnel also shows the overall conversion rate. The stage with the larger visitor loss is marked with an amber Biggest leak label.
A loss between Opens and Started can indicate that visitors decided not to begin. Possible causes include the form appearing too long, an unclear purpose, or a slow page. A loss between Started and Submitted can indicate difficulty during form completion. Use the field-level table below the funnel to investigate where this happens.
Where people drop off
The field-level table lists fields in their order on the form. For each field, it shows:
- How many visitors reached the field.
- How many visitors completed it.
- The median time visitors spent on it. Times over 10 minutes are excluded because they are treated as abandoned browser tabs.
The field that loses the largest share of visitors who started the form is highlighted in amber and identified in the header label. Consider whether this field can be shortened, simplified, made optional, or moved later in the form.
Median time provides additional context. For example, if visitors spend 40 seconds on one question and 6 seconds on nearby questions, the question may require more effort or may be unclear.
Data quality
The Data quality section counts submissions that may need review. These submissions are flagged but not removed, and they remain included in all charts:
- Speeders — finished in under 20 seconds.
- Straight-liners — chose the same option position across three or more choice questions.
- Duplicate emails — the same email address submitted more than once (requires an email field on the form).
If the form does not contain the fields required for a check, that row is not shown. It is not displayed with a value of zero. When no submissions are flagged, the section shows an All clear label.
When the band shows less
- Low volume: when the report has fewer than 100 visitors, the leak marker and worst-field identification are disabled because there is not enough visitor data to support them. A Low volume label appears instead.
- Collecting: if the form does not yet have enough activity, the band shows Journey data appears as new visitors arrive.
- Re-publish to start collecting: journey tracking is added to the form page when the form is published. Forms published before Insights launched record page opens but not field-level events. Re-publish the form to begin collecting the full set of Journey data.
For a visual overview of drop-offs, data quality, response charts, AI analysis, and report sharing, watch Turn Form Submissions into Insights.