
Explore your data
On this page
Explore your data helps you investigate a specific chart value or group of responses without changing the underlying submissions. You can view example text answers, apply a value as a report-wide filter, save filters for reuse, and organize answer categories for clearer reporting.
Drill-down
On charts that show answer counts, hover over a bar, slice, point, or other chart value to highlight it. Click the highlighted value to explore the responses behind it.
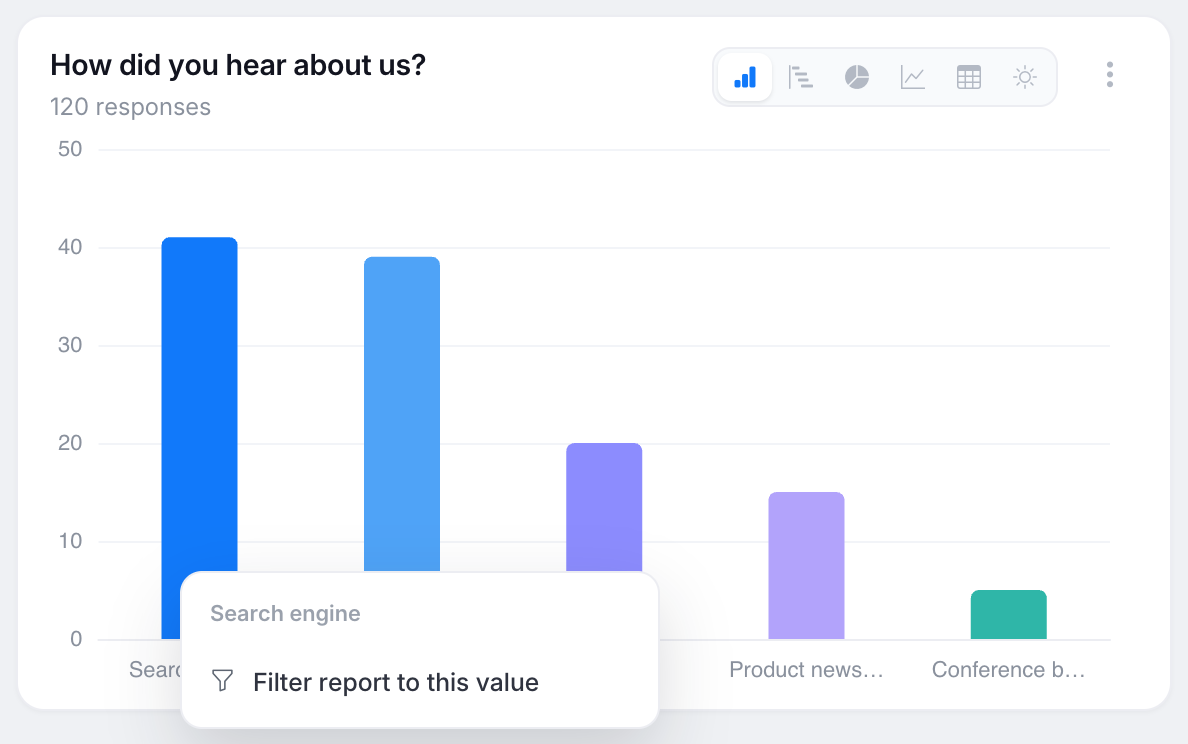
- Show example answers (text fields) — view the most recent answers, using their original text, that are included in the selected chart value.
- Filter report to this value — limit the entire report to responses with the selected answer.
Report-level filters
Active filters appear as blue chips in the action bar. They apply to:
- Every chart in the report.
- The KPI values for the selected period.
- The submission count in the report header.
Remove a filter chip to stop applying that filter.

Saved filters
The saved-filter picker, located to the left of Compare to previous period, lists All submissions and each saved filter with its current response count. When at least one filter is active, select Save current filters to name and save the filter set. Anyone who can access the report can then reuse it without configuring the same filters again.
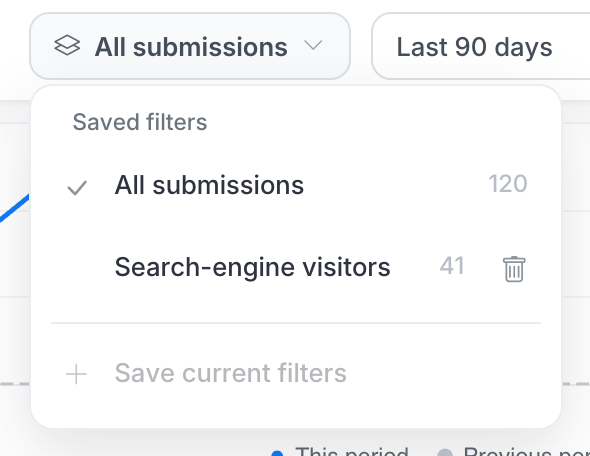
Exports and the shared public page show the saved report. They do not include temporary filters applied by the current viewer.
Clean up categories
Select ⋮ → Clean up categories on a chart to view the field’s raw answers and their counts. To combine variants under one label, enter the same Display as value for each one. For example, map both “NYC” and “New York City” to “New York.” You can also hide values that should not appear in the report.
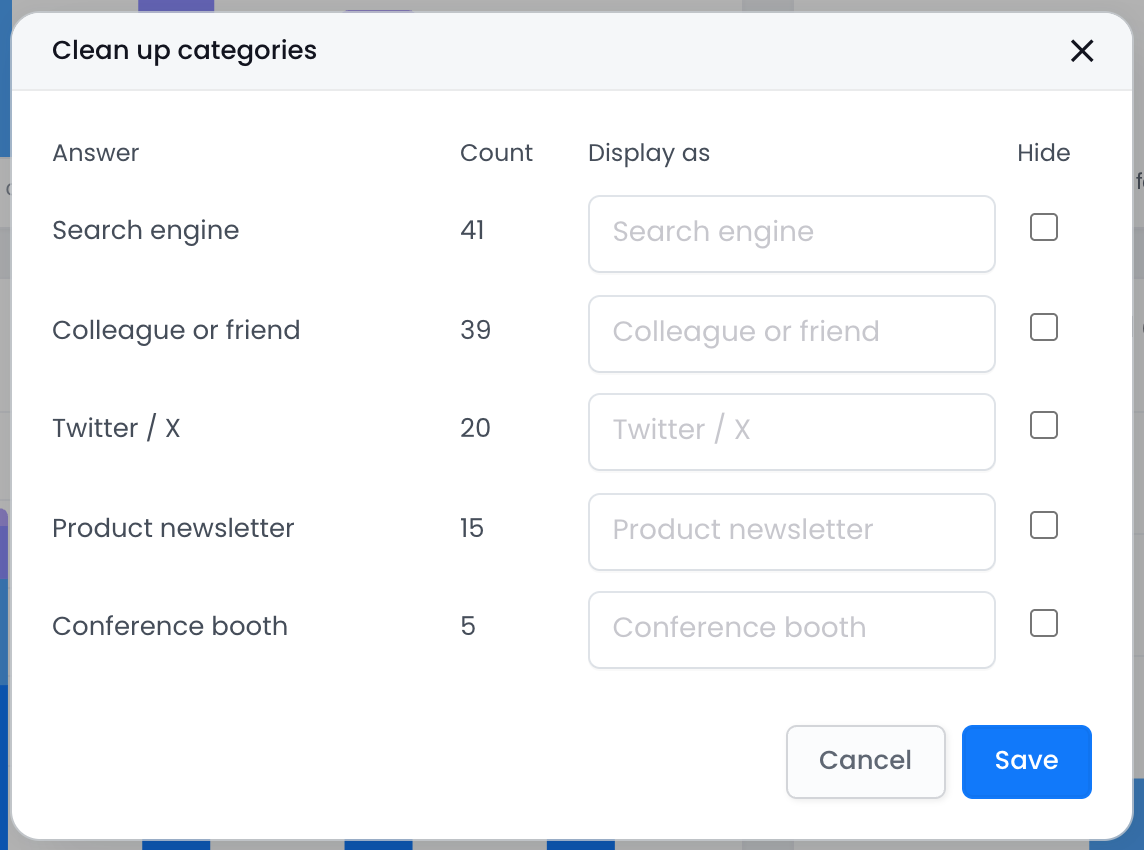
Category cleanup changes how answers are displayed but does not modify the underlying submissions. Mappings take effect at display time and can be reversed at any time. They apply to one field and are shared by all reports for the form. AI classification, described in AI in Insights, uses the same mapping system. Manually created mappings take precedence over AI-created mappings.