
Create and switch reports
On this page
Every form has a default report named Insights. You can also create additional reports for different audiences or types of analysis, choose which fields each report includes, and optionally start with a submission trend and recommended charts.
Create a report
-
Go to Submissions and select a form.
-
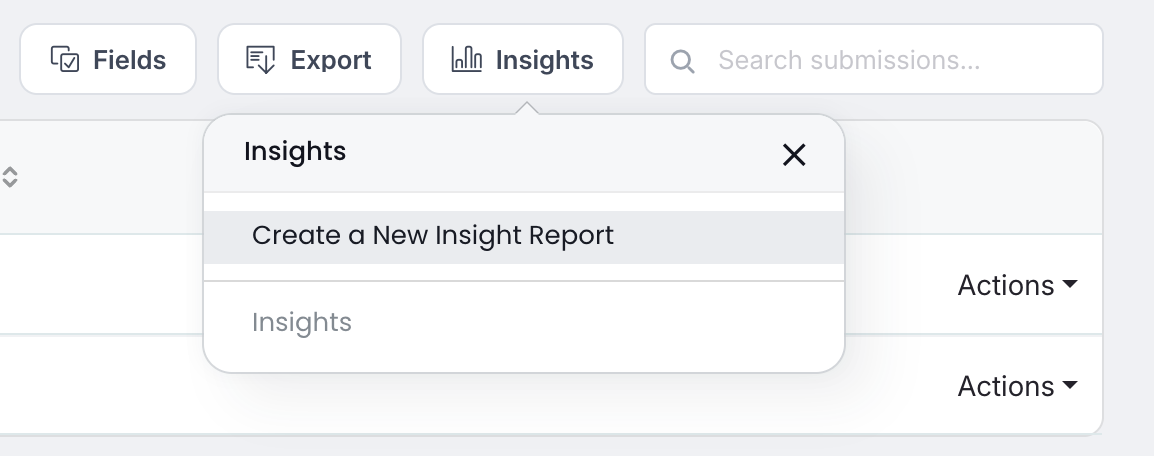
Click Insights, then select Create a New Insight Report.
-
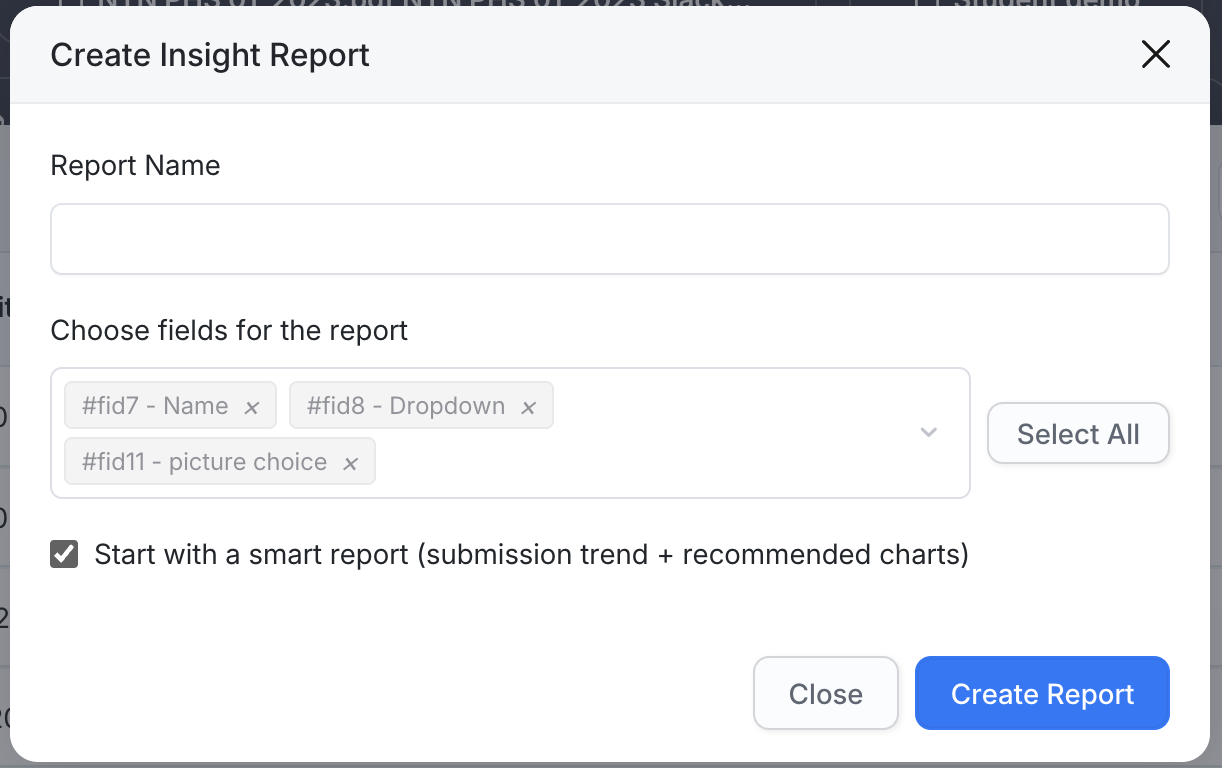
Enter a Report Name.
-
Under Choose fields for the report, select the fields you want to include. Click Select All to include every available field.
-
Choose whether to keep Start with a smart report (submission trend + recommended charts) selected.
-
Click Create Report.
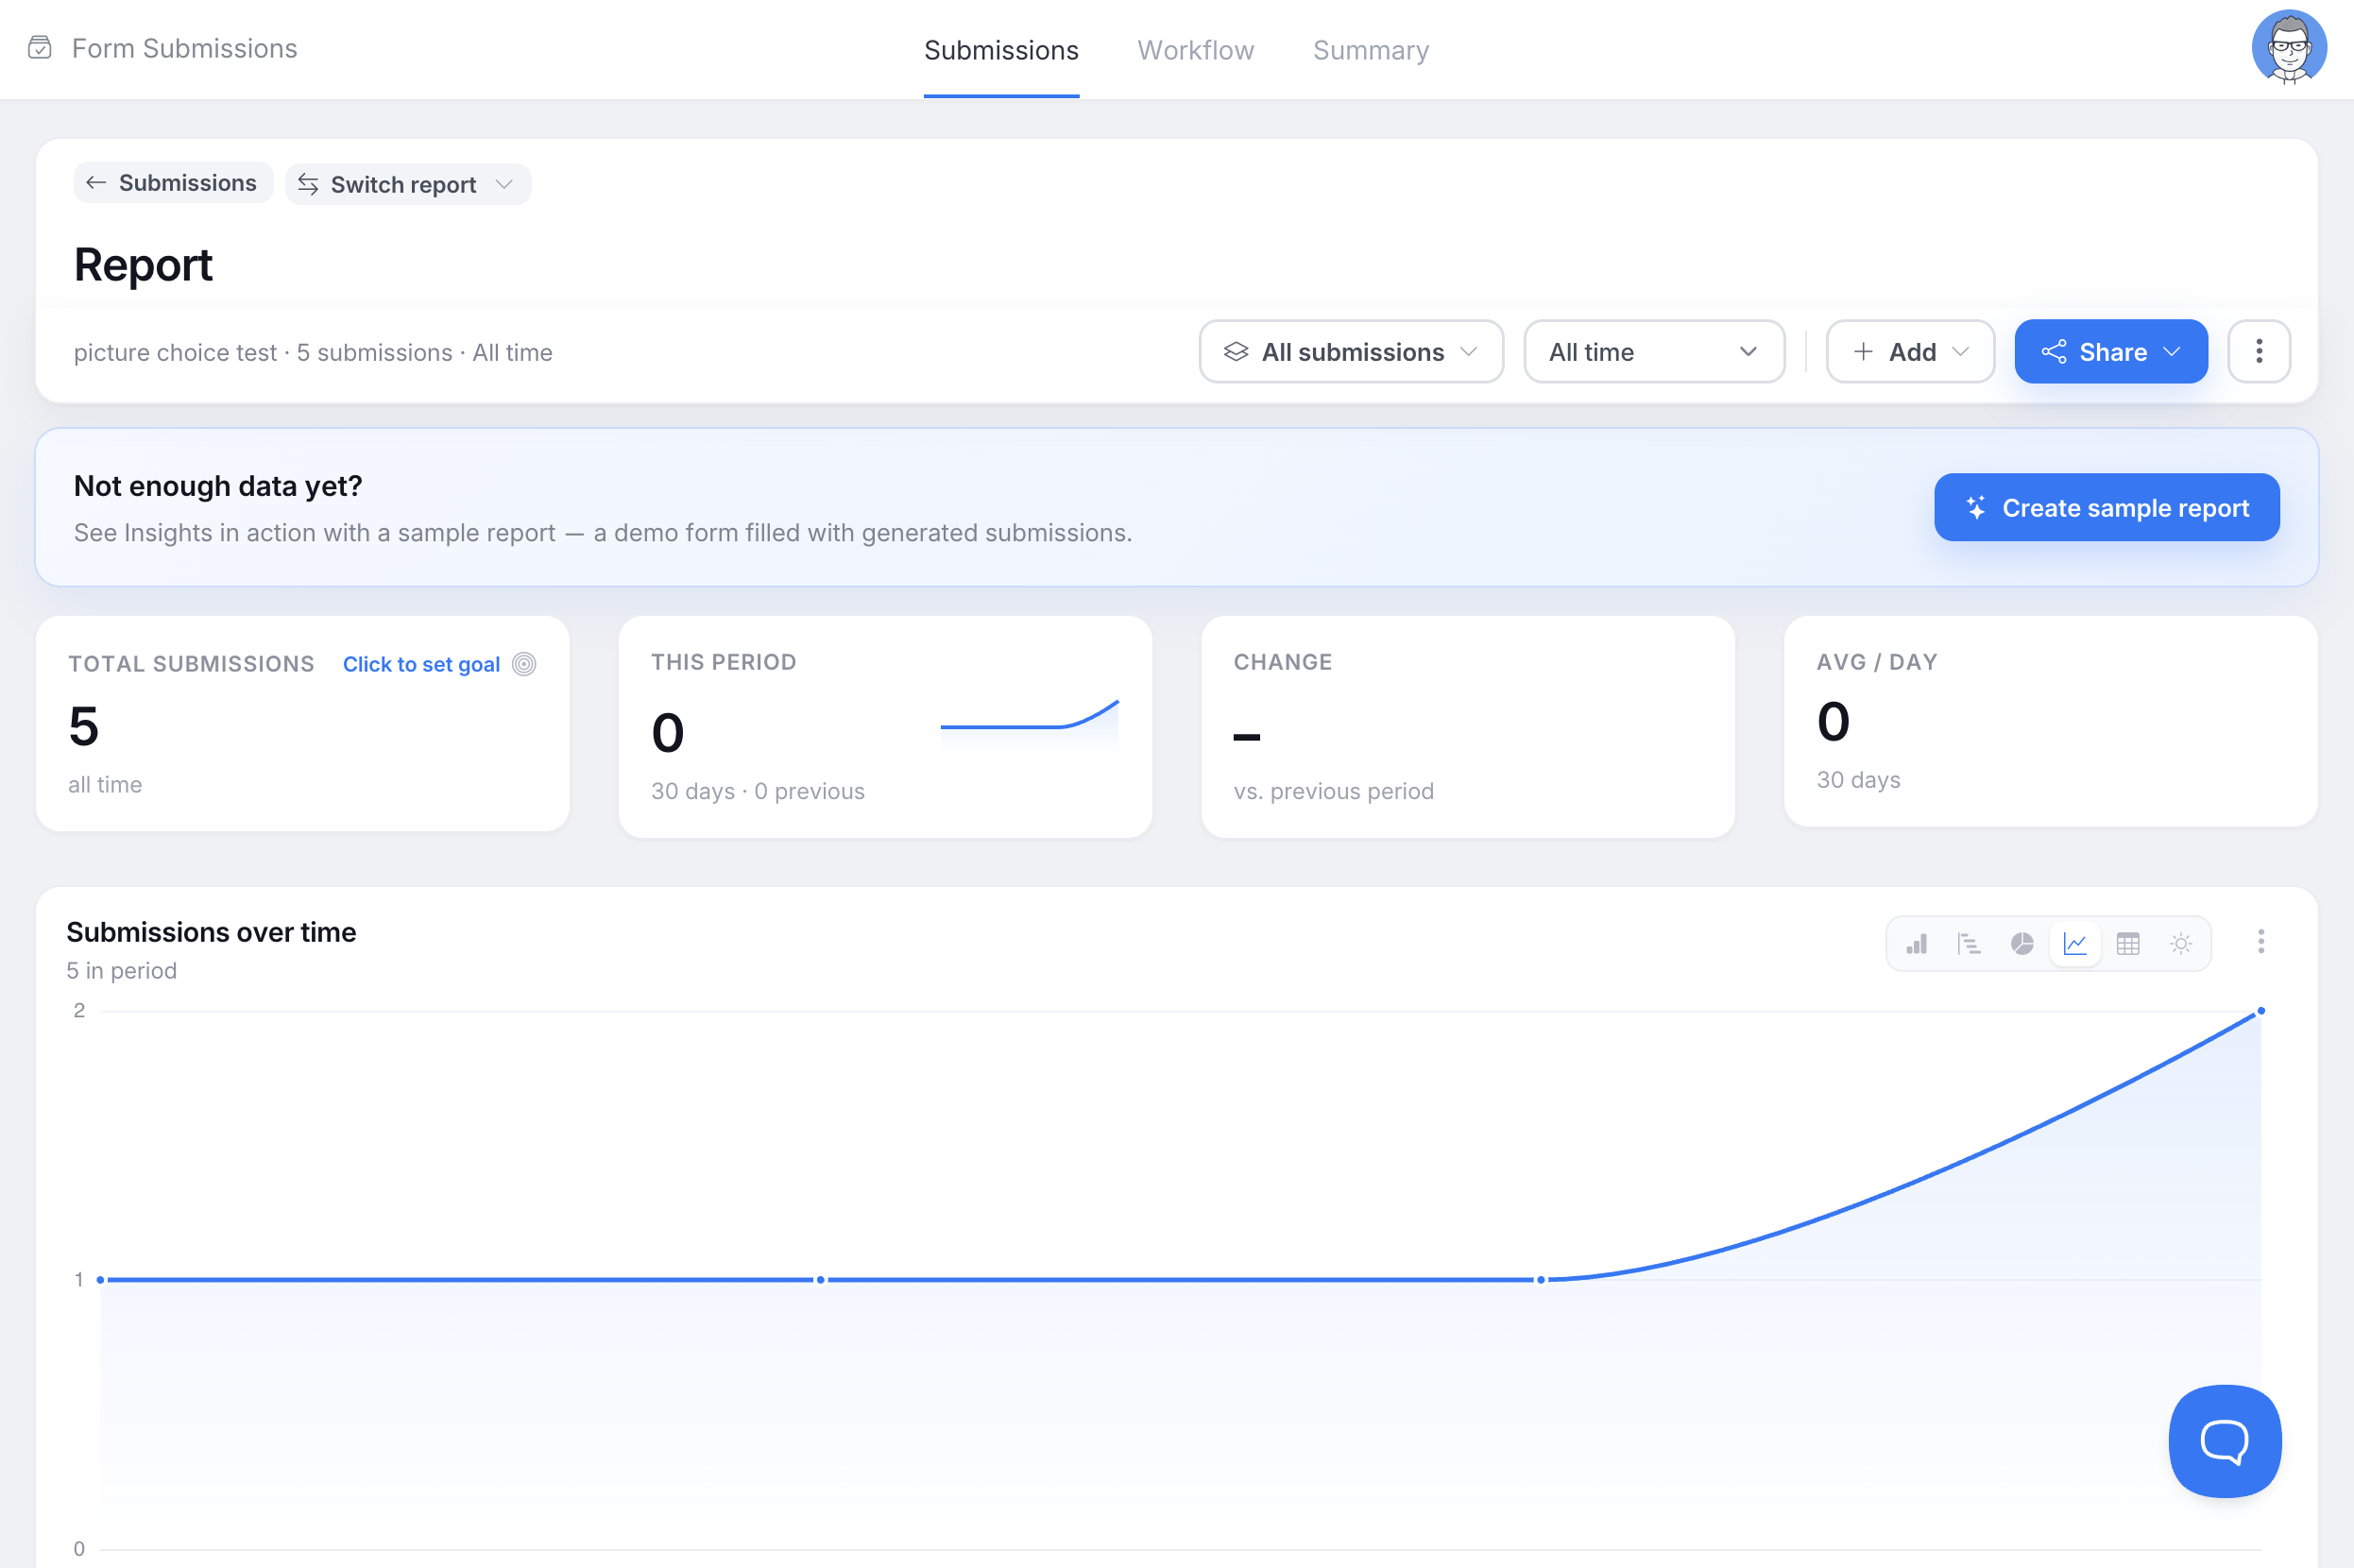
The report opens with summary metrics and charts based on your selected fields.
Switch reports
Open Switch report to move between reports for the same form or select Create a New Insight Report. The menu identifies the current report with a checkmark and marks the form’s default report with a Default tag.
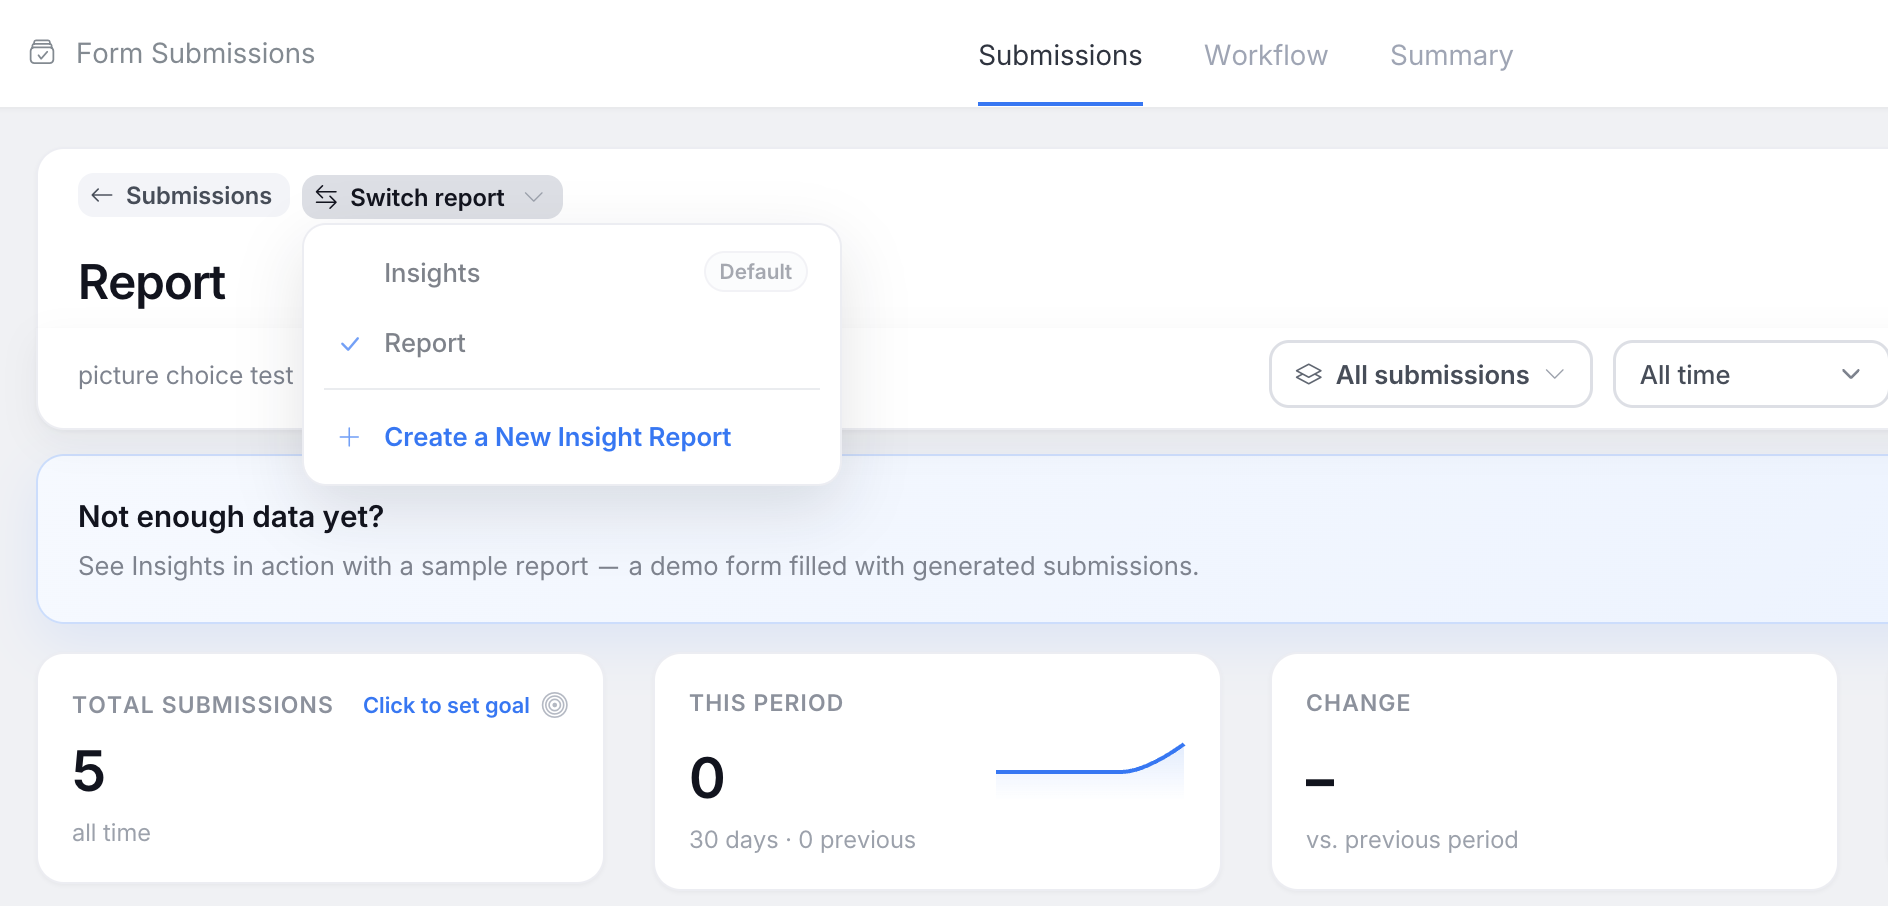
To make another report the default, hover over its row and click the pin icon (Make default). The default report is shared by the whole team.
Continue working with the report
The report page lets you change the date range, add or edit charts, filter responses, compare periods, and share or export the results. Reports can also include visitor journey data, goals, alerts, and AI analysis when those features apply.
See the Insights overview for all reporting features, or go directly to:
- Charts and analysis for chart types, statistics, and chart controls.
- Explore your data for filters, drill-downs, and answer categories.
- Packs, alerts, and sharing for report sharing, PDF and CSV exports, alerts, and email digests.