
Insights
On this page
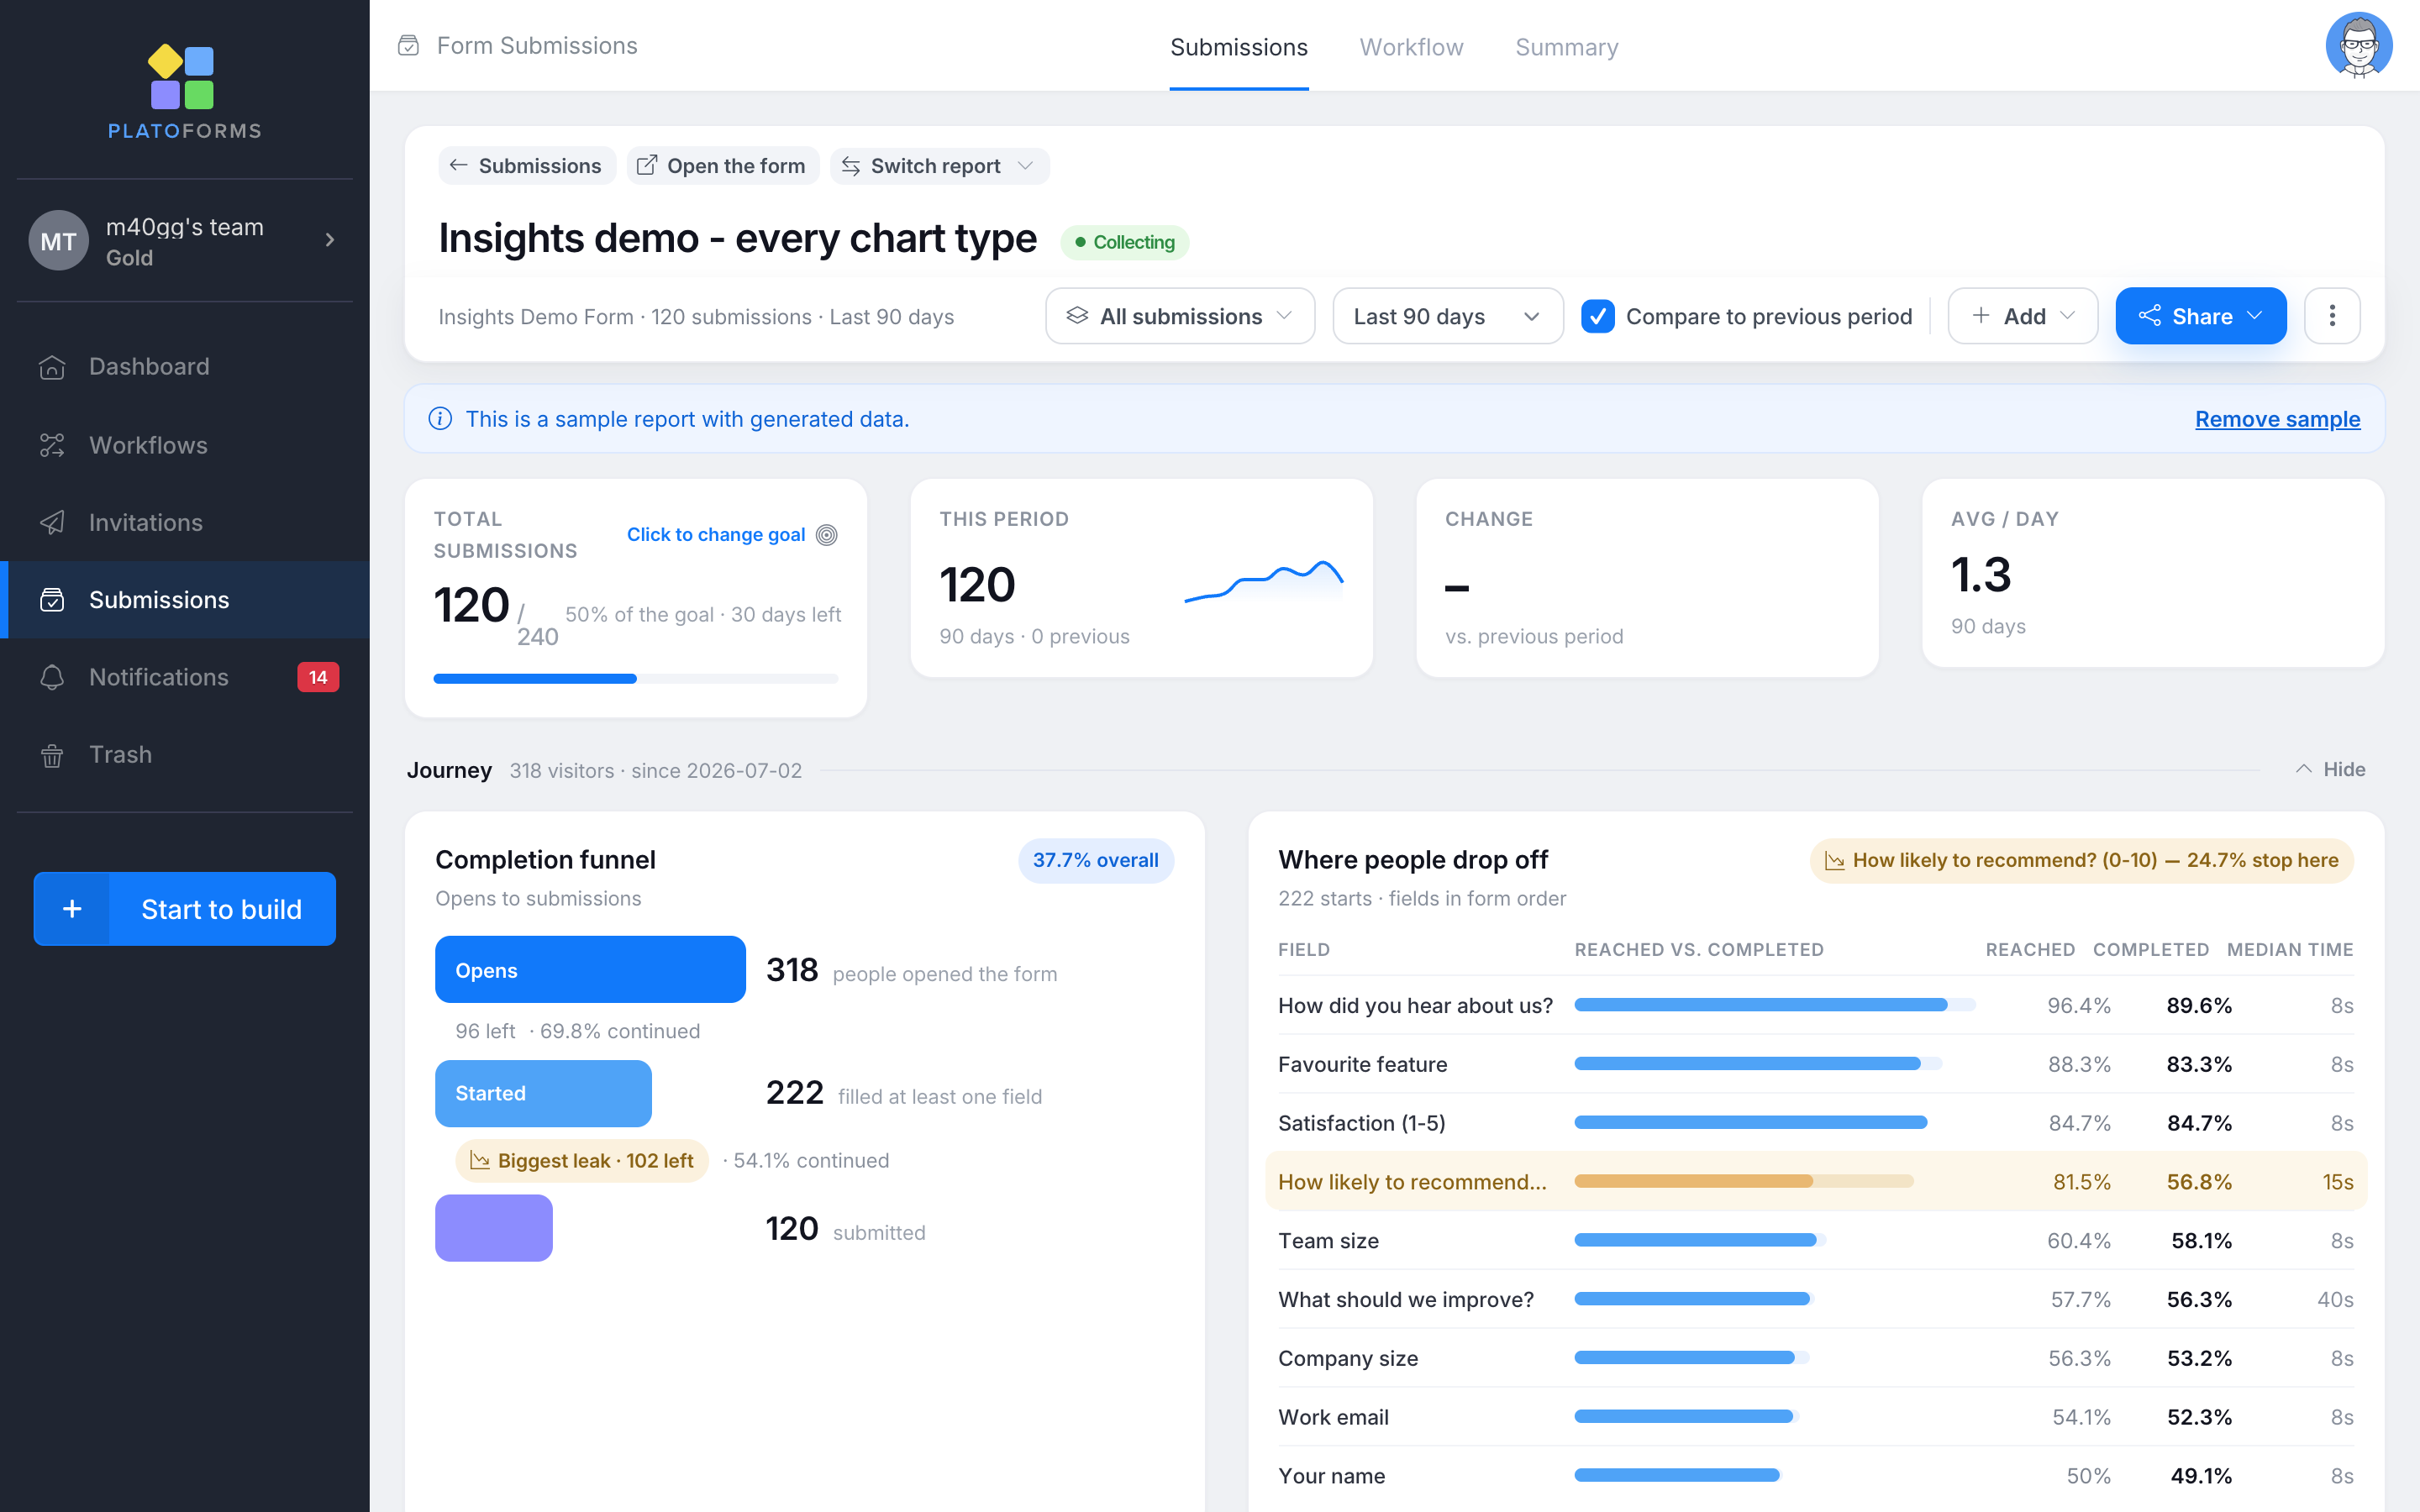
Insights is a reporting tool for understanding form submissions and visitor behavior. It creates a default report for each form, so you can review submission trends and answer distributions without first building charts manually. You can then filter and compare the data, find where visitors leave the form, set goals and alerts, use AI to analyze the report, and share the results.
What can Insights help you understand?
- How do I create or switch reports? See Create and switch reports to choose fields, start with recommended charts, move between reports, or change the default report.
- Where do visitors leave the form? Use Visitor journey to review the completion funnel, identify fields where visitors stop, and check data-quality signals.
- What patterns appear in the responses? Use Charts and analysis to view statistics, word clouds, cross-tabs, differences between groups, and unusual days.
- How do responses change for a specific group? Use Explore your data to drill into answers, filter the report, save filters, and combine or hide categories.
- What do written responses say overall? Use AI in Insights to ask questions about the report, group text responses by theme and sentiment, and generate titles, captions, or summaries.
- How can other people receive the results? Use Packs, alerts, and sharing to configure email alerts and share reports through links, embeds, digests, and exports. This guide also explains how to add a predefined set of charts with a template pack.
- Which form fields support each type of analysis? See Design forms for Insights for the relationship between question types and available charts or analyses.
Video tutorial
Follow the complete Insights workflow—from opening a sample report and tracking drop-offs to AI analysis, goals, alerts, sharing, exports, and scheduled email digests.
Open Insights
There are two ways into Insights:
-
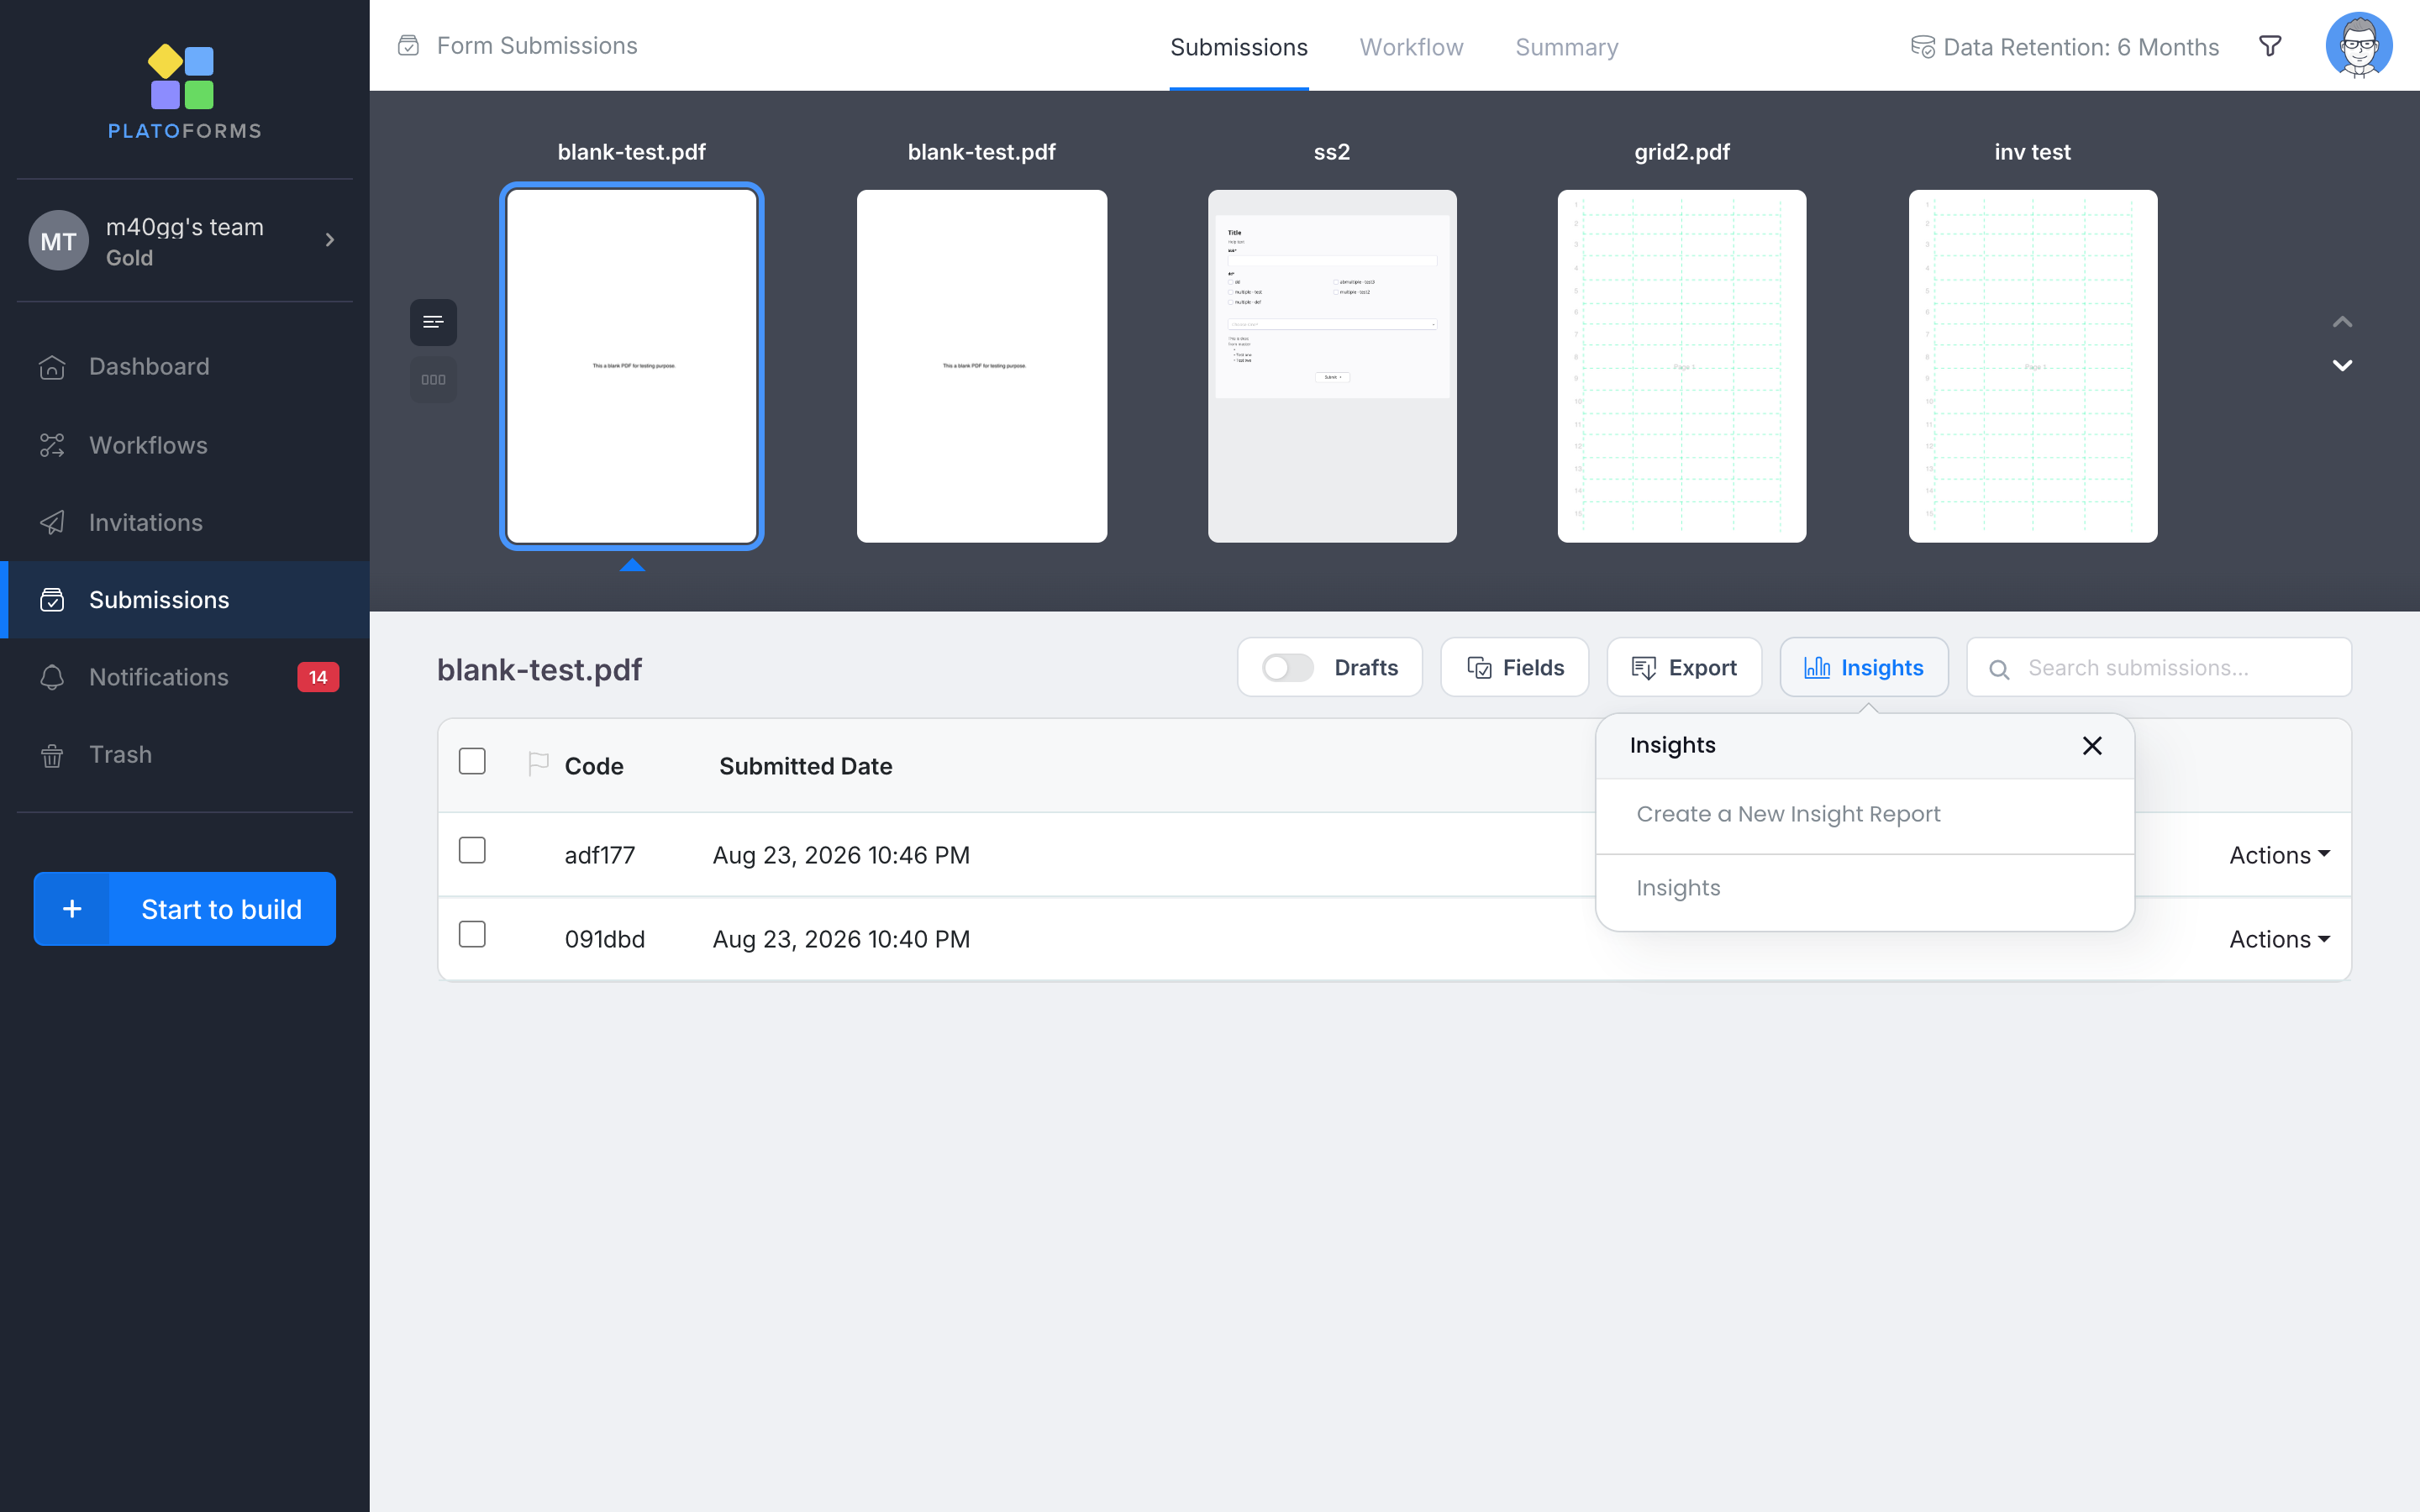
From the Submissions page: select a form and click Insights in the toolbar. The menu lists every report on the form, plus Create a New Insight Report.
-
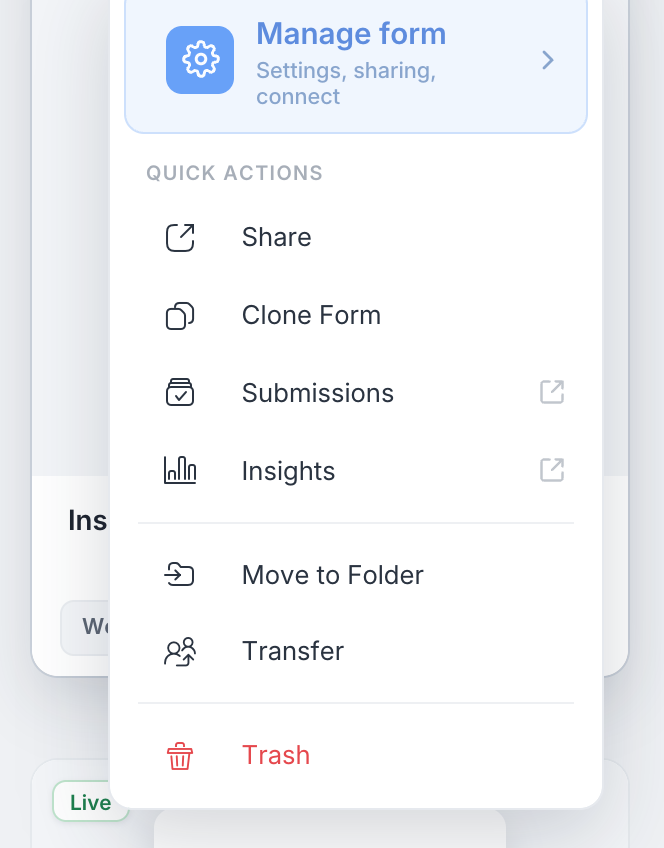
From the Dashboard: every form card’s gear menu has an Insights action under Submissions. Select it to open the form’s default report.
To create an additional report or move between reports for the same form, see Create and switch reports.
Start with the default report
Every form automatically has a default report named Insights. It contains a Submissions over time chart and one chart for each reportable field. The initial chart type depends on the field type. If you rename the report, edit a chart, or add content, it becomes a regular editable report.
Try Insights with sample data
If a form has no submissions, click Try Insights with a sample report on the empty Submissions page. The same option appears above the KPI tiles when the current form has fewer than 10 submissions.

This creates a demo form in your team with generated submissions, visitor journey data, every chart type, a saved filter, a goal, and an alert. A team can have one sample. Generated submissions do not count toward plan quotas. To delete the sample, click Remove sample in the report banner.
Understand the report page
Across the top of a report:
- Submissions returns to the submission list.
- Open the form opens the live form.
- Switch report switches between the form’s reports in place or creates a new one.
The action bar under the title stays pinned while the report scrolls. It contains:
- The form name, submission count, date range, and active-filter chips.
- The saved-filter picker and Compare to previous period.
- Date ranges: All time, Last 7 / 30 / 90 days, Last 12 months, or Custom. The selected range applies to every number on the page.
- Add, Share, and the ⋮ menu for editing the report name or color, managing alerts, and deleting the report.
When Compare to previous period is enabled, time charts show the previous period as a dashed series. A label next to a chart subtitle can also identify a change, such as ↑ 1.6× vs previous period or New top answer. These labels are calculated from the report data and do not use AI.
KPI tiles

- Total submissions — the all-time total and, when configured, progress toward a goal.
- This period — submissions in the selected range, with a sparkline.
- Change — this period vs. the previous one.
- Avg / day — the daily average over the range.
- Conversion — appears when the form has recorded page opens: submissions ÷ opens for the period. It hides itself while a filter is active, because a page open cannot be attributed to an answer-based filter.
Set a submission goal
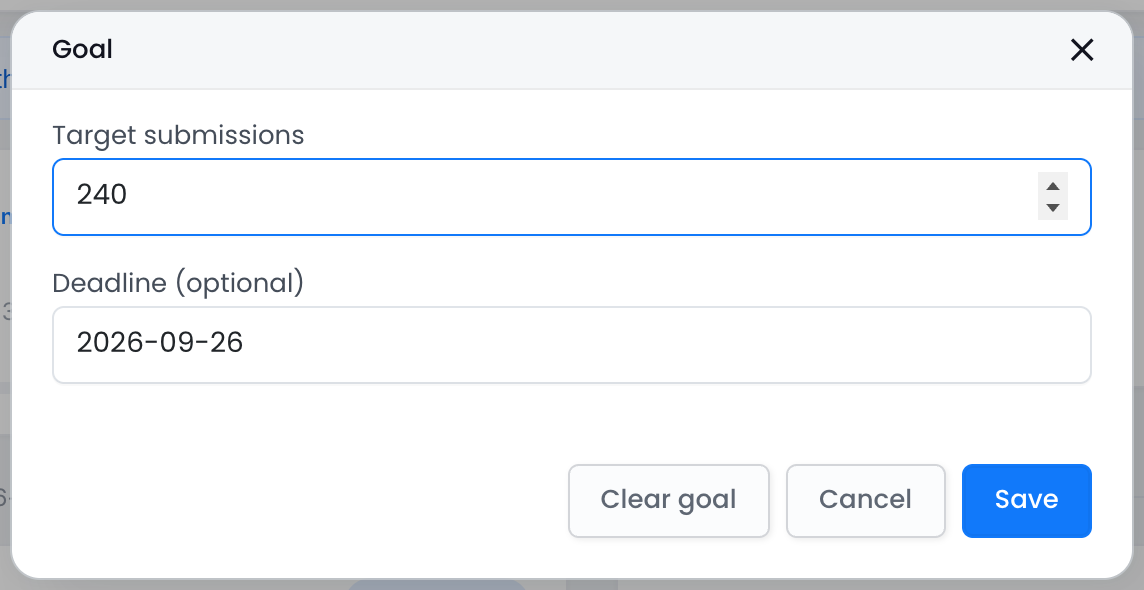
Click the target icon on the Total submissions tile to set a target and an optional deadline. The tile then shows progress, such as 120 / 240 and 50% of the goal · 30 days left. It turns green when the goal is met. Goals are saved with the report and are visible to the whole team.
Plan limits
On the free plan a report can hold up to 5 charts (and the default report covers the first 5 fields). Breakdown fields, share links, and email digests require a paid plan.